8 important CX metrics and KPIs (and how to measure them)
-3.jpg)
Why are CX metrics important?
It is one thing to believe your CX strategy is on the right track and another to know it. Enter customer experience metrics. These figures can help measure and showcase how your people and products are performing and, in turn, identify potential KPIs and areas for improvement.
They help business leaders see the business from the perspective of its customers; a CX take on the popular saying ‘put yourself in someone else’s shoes’. You’re able to analyse and extract data from different stages of the customer journey to then pinpoint exactly where there are points of friction for your consumers.
According to Gartner, more than 5,000 organisations have a dedicated CX leader, with 50% of them reporting directly to the CEO2. This growth in CX oversight at senior levels of an organisation further amplifies the importance of effective CX measurement controls.
Who is responsible for what CX metric? That depends, but usually, CX measurement is a responsibility of all major organisational departments with popular allocations including:
- Marketing: customer retention and loyalty
- Customer service: call resolution
- Finance: repeat orders
- Operations: timeliness
It is possible to have over 50 CX metrics within one large organisation with revenue in excess of $1 billion2, however, for simplicity purposes, these metrics can be grouped into the following key areas:
- Customer satisfaction
- Customer loyalty, retention and churn
- Brand advocacy and reputation
- Quality of operations
- Employee engagement.
Given the plethora of CX metrics available, here is a snapshot of those that will best help you learn how your customers are interacting with your brand and guide the next phase of your CX strategy.
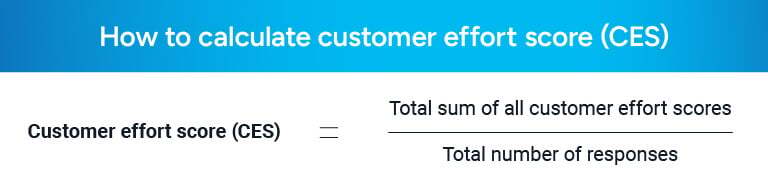
1. Customer effort score (CES)
A transactional metric, this powerful tool effectively measures how much effort your customers need to make to complete a task – or, in other words, how simply they can find something. This could range from getting a support request handled to identifying the product or service they were looking for.
The more effortless you make the customer experience, the more likely customers will buy from you again. In fact, 96% of customers with high-effort experiences reported being disloyal compared to only 9% of customers with low-effort experiences3.
So how do you measure CES? Typically by sending a post-interaction survey that asks customers to rate their experience from low to high and then calculating the average score and distribution of scores. You can then use this data to see where CX friction points exist and how to make your services easier for customers to use.
2. Net promoter score (NPS)
Helping to predict customer purchase and referral behaviour, NPS typically takes the form of a single survey question. The most famous examples ask respondents to rate the likelihood they would recommend a company, product or service to a friend or colleague on a scale from 1-10.
Simple to calculate and highly effective, respondents can be split into three categories – detractors (answered 1-6), neutrals (7-8) and promoters (9-10). Subtracting the total number of detractors from your promoters will reveal your NPS, which can then be used to benchmark your performance against other companies that use the tool.
As NPS is broad in nature, it should not be used to measure product success. It is more focused on identifying how loyal customers are, their willingness to promote your brand and how such intentions change over time.
.jpg)
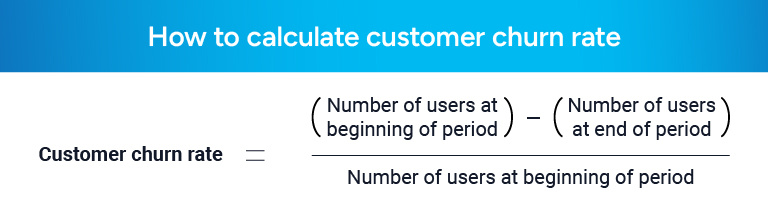
3. Customer churn rate
Customer churn rate is calculated by dividing the number of customers lost during a set timeframe by the number you had at the beginning of the period. It is based on the premise that people won’t walk away from a business if they are having a positive experience.
Businesses love a low churn rate because it means they have more loyal customers. By monitoring the customer churn rate it is possible to pinpoint moments when customers start falling away and aims to identify the reasons the drop-off occurred. Diving deeper into customer demographics can also lead to product adjustments targeted at specific groups of users. It is also about having the visibility one needs to make adjustments to improve the customer experience before it’s too late
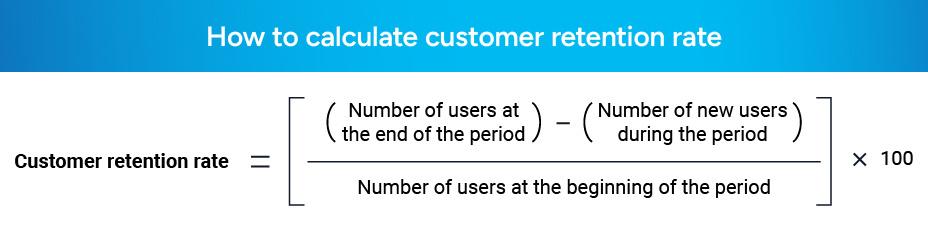
4. Customer retention rate
This metric measures how many customers stay with your business over a set period. Retention can also show you when they are likely to stop using your service, be it after a week, month or quarter. Needless to say, strong CX can entice customers to keep coming back and thus lower overall costs and increase loyalty rates.
There are a few ways to calculate your customer retention rate including subtracting the number of customers who churn over a period from those who remain loyal. As an example: 80% retention minus 20% churn equals a 60% retention rate. Another is to compare how many customers stay loyal between two similar periods. As an example, 2021 compared with 2022.
Studying retention is an ideal way to get a better handle on CX by tracking certain moments in a product or service’s life cycle. This allows you to consider improvements or enhancements that give customers a reason to continue using it. The importance of this cannot be understated as it is certainly more expensive to attract and onboard new customers than it is to keep current ones.
5. Customer satisfaction score (CSAT)
As the name suggests, CSAT measures the average satisfaction of customers. Knowing how happy – or unhappy – customers are with your business or services is crucial in meeting today’s expectations and planning for tomorrow. CSAT surveys are often given within a few hours of a transaction or event and asked customers to rate their satisfaction on a scale from ‘very satisfied’ to ‘not satisfied at all.’
CSAT is typically used to measure satisfaction related to specific interactions such as making a booking, returning a product or phoning a call centre. The targeted nature allows you to use CSAT responses to learn what parts of a product or process leave customers satisfied or unsatisfied, with adjustments then able to be rolled out to tackle specific issues or concerns.
.jpg)
6. Average resolution time (ART)
Nothing negatively impacts CX quite like wasting a customer’s time. ART identifies how long it takes on average to solve a customer issue and identifies the efficiency of both the organisation and specific support teams. It is a particularly powerful metric for call centres or support desks and can have a direct impact on your company’s CSAT score.
The calculation is simple – take the total time it takes to resolve all issues over a set period and divide it by the number of calls or interactions. One of the great strengths of measuring ART is the ability to notice sudden spikes in resolution time and consider the reasons that may be occurring. If multiple customers are spending additional time on the phone line or help desk, it may well be a sign of the complexity of a product or service rather than unnecessary engagement by staff members.
.jpg)
7. Customer lifetime value (CLTV)
Customer Lifetime Value (CLTV) is the predicted total revenue a business expects from a single customer throughout their entire relationship. It helps businesses understand the long-term value of each customer and make informed decisions about acquisition and retention spending.
Imagine a coffee shop with a loyalty program. A regular customer might spend $5 per visit, visiting 3 times a week and remain a loyal customer for 5 years.
CLTV calculation: $5/visit x 3 visits/week x 52 weeks/year x 5 years = $3,900.
This means the coffee shop can reasonably expect that customer to generate $3,900 in revenue over their relationship. This information can help the coffee shop determine how much to invest in loyalty programs, discounts and other initiatives to retain existing customers.
.jpg)
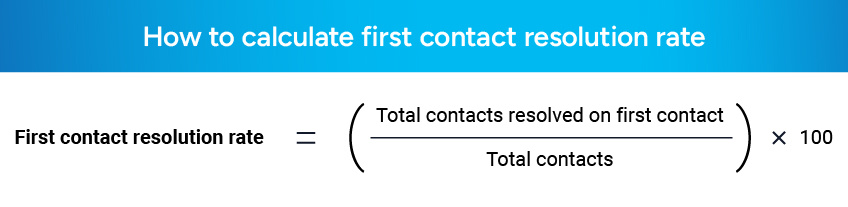
8. First contact resolution rate (FCRR)
First Contact Resolution Rate (FCRR) is a key customer service metric that measures the percentage of customer enquiries resolved during the first interaction, without the need for transfers, escalations or follow-up calls. It reflects a company's efficiency in addressing customer needs and their ability to provide quick and effective solutions.
A contact centre receives 100 calls. Out of these, 70 calls are resolved during the first interaction, while 30 calls require follow-up or further assistance.
FCRR calculation: (Resolved calls / Total calls) x 100 = (70 / 100) x 100 = 70%
In this example, the FCRR is 70%, indicating that 70% of customer issues were resolved on the first contact.
Want to improve customer satisfaction scores by over 80%?
What about achieving a net promoter score of 30+ for voice channels and 60+ across messaging channels? An easy-to-implement, AI-powered and cloud-based plugin brought these very real results to a large private Australian health insurer. Get a free copy of the case study here.
References
1 https://walkerinfo.com/cxleader/customers-2020-a-progress-report/
2 https://www.gartner.com/smarterwithgartner/how-to-measure-customer-experience
3 https://www.gartner.com/smarterwithgartner/effortless-experience-explained/
Related Articles


%20tech-%20a%20banking%20and%20finance%20gamechanger-3.jpg)